Unlocking the Value of S&OP with the Value Anticipator
- Doug Dedman
- Nov 22, 2024
- 3 min read
Evaluating the full potential of an effective S&OP process is easier with the right tools, and the Value Anticipator is designed to do just that. S&OP is a strategic process that touches nearly every part of your business. Because of its wide-reaching impact, it can be tricky to gauge the full scope of its effectiveness. That’s where the Value Anticipator comes in.
Whether your S&OP process is just starting out or well-established, this tool offers a practical way to estimate the bottom-line benefits of an effective S&OP process. Keep in mind, the results are rough estimates, you’ll want to customize values, categories, and calculations to make it as relevant as possible to your business. Download the Value Anticipator here. Let’s dive in!

Breaking Down the Value Anticipator
The Value Anticipator is divided into three main sections:
Company Profile
Expected Returns
Internal Rate of Return (IRR)
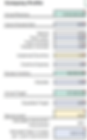
1. Company Profile
Start by filling in your company’s key metrics. The more details you provide, the more accurate your projections will be. Let’s walk through an example:
Annual Revenue: Enter the revenue of the specific business unit you’re analyzing. For example, $100,000,000.
Cost of Goods Sold (COGS): Input this as a percentage of revenue or a dollar value. Let’s say COGS is 60%. Break this down further:
Material: 40% of COGS
Direct Labour: 30% of COGS
Fixed and Variable Overhead: 15% each
Unplanned Downtime: Estimate downtime as a percentage of production days. If you had 3 days of downtime out of 22 scheduled days, that’s 14%.
Overtime: Similarly, calculate overtime (e.g., 2 days out of 22 = 9%).
Next, input inventory metrics:
Excess Inventory: For example, $5,000,000.
Obsolete Inventory Write-Off: Perhaps 15% of your excess inventory.
Lastly, consider transportation costs and service levels:
Annual Freight Costs: Example, $7,000,000.
Expedited Freight: Say 20% of total freight costs are expedited.
Service Levels: For on-time delivery, estimate the percentage of shipments delivered on time (e.g., 80%). If improving this by 1% could add $250,000 in revenue, you can project the impact of increased service levels.
2. Expected Returns
With the company profile complete, the Value Anticipator calculates expected returns over a three-year timeline:
Year 1: 20% value capture
Year 2: 80% value capture
Year 3: 100% value capture
Each improvement category reflects industry benchmarks and client data, but feel free to tailor these to your organization’s goals.
Example Calculation
Excess Inventory Reduction is calculated by taking the excess inventory ($5,000,000) and multiplying by both the expected improvement (30%) and the value capture for the year (20%).

3. Internal Rate of Return (IRR)
Finally, the IRR table helps you see the potential returns on an S&OP investment. We use IRR in this model to measure the annual compound growth rate of investing in a mature S&OP process.
In year one, this will equal the standard project ROI, but as the process matures, S&OP delivers compounding benefits for a business. Knowing where the benefits lie in a mature S&OP process are critical for setting budgets and gaging improvement opportunities around S&OP.
Example Calculation:
To calculate the year 1 IRR you take the year 1 total cash flow ($1,123,545) and divide it by the initial investment ($150,000) and subtract 1 to get a final answer of 6.495 or 649%.

What’s Next?
The Value Anticipator is a starting point to unlock the potential of S&OP for your organization. If you’re ready to take the next step download the Value Anticipator here. Thanks for reading, let’s turn your S&OP process into a strategic advantage!
Professional Support for Your S&OP Journey
Does your company need help implementing the 5-Section Sheet or enhancing your overall S&OP process? We offer professional services that include coaching, guidance, and support to ensure you get the most out of your S&OP journey. Reach out to us today to learn how we can help your team uncover the right story behind your numbers and make the best strategic decisions!
At DBM Systems, our consultants have over 20 years of experience providing S&OP leadership to businesses worldwide. We equip teams with coaching and the tools to quickly start and sustainably run an effective S&OP process. Learn about our process and unlock the power of S&OP in your organization.